Appendix C: Overview of immigration detention population
1.1
This appendix provides a context to the body of the report by outlining
the major characteristics of the immigration detention population and trends in
recent years.Ā It acknowledges that the current detention population is
different in size and composition to that of 2000-01, when the immigration
detention system was put under intense pressure by large numbers of
unauthorised boat arrivals. In summary, the trends outlined are of:
n decreasing absolute numbers
of people in immigration detention in Australia
n a detention
population of changing composition; that is, a population now dominated by visa
overstayers and visa cancellation cases, and
n a general decrease in
the length of immigration detention.
Numbers of people in immigration detention
1.2
Figure C.1 illustrates the rise and fall of numbers of people in
immigration detention since 1989, when the Migration Legislation Amendment
Act 1989 was passed. The number of people in immigration detention in Australia was at its highest between 2000 and 2002, but dropped dramatically in 2003, and
had halved again by 2007. In late 2008, the Minister for Immigration and
Citizenship announced that the number of people in immigration detention was at
its lowest level since 1994.[1]
Figure C.1ĀĀĀĀ Trends in immigration detention in Australia from 1989 to 2007
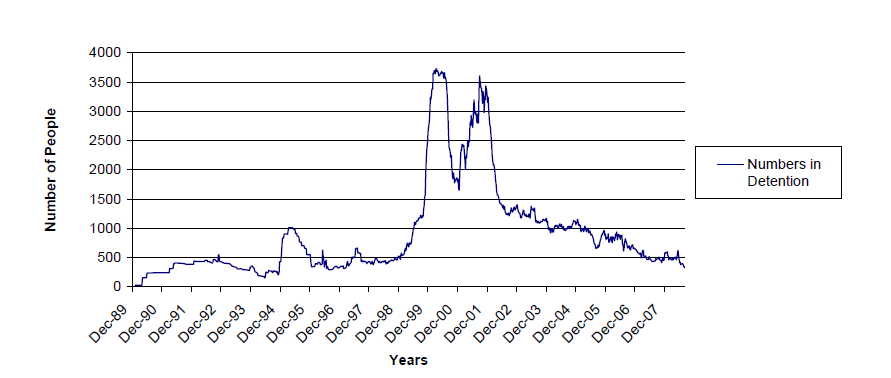 Source:ĀĀĀ Department
of Immigration and Citizenship, submission 129d, p 2.
Source:ĀĀĀ Department
of Immigration and Citizenship, submission 129d, p 2.
Immigration detention population by mode of arrival
1.3
Two groups of people are liable to be taken into immigration detention
in Australia: those who arrive unlawfully without a valid visa; and those who
enter Australia on a valid visa and then become unlawful, either because their
visa expires or they breach the conditions of that visa, resulting in a cancellation.
1.4
A common assumption is that AustraliaÆs detention policy mainly captures
unauthorised boat arrivals claiming asylum under AustraliaÆs international
obligations.Ā This has been true in the past. Between 1999 and 2002 more than
half of those in immigration detention in Australia were unauthorized boat
arrivals. It is not, however, the case at the present time. Since 2003, overstayers
and those with visa cancellations have been the majority.[2]
1.5
Figure C.2 maps the broad trends in the detention population by arrival
type since 1989-90. Of particular note are:
n peaks in unauthorised
boat arrivals in 1994-95 and 2001-02
n a peak in illegal
foreign fishers in 2006, and
n a steady increase in
the number of visa overstayers in detention, peaking in 2005 and now declining.
Figure C.2ĀĀĀĀ Trends in immigration detention by arrival type
and/or reason for detention
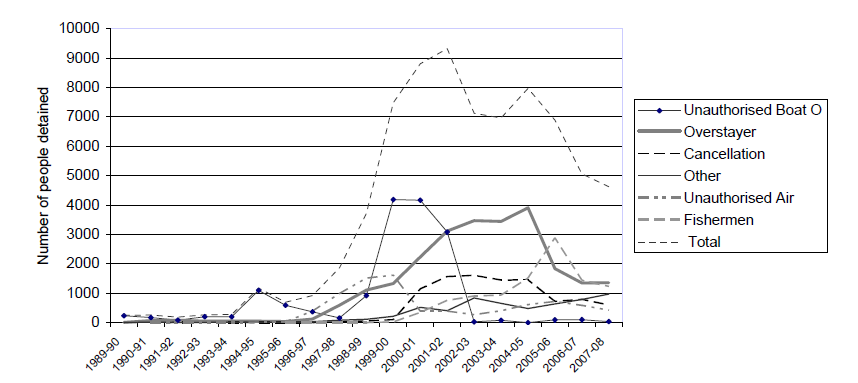 Source:ĀĀĀĀĀĀ Department
of Immigration and Citizenship, supplementary submission 129d, p 2.
Source:ĀĀĀĀĀĀ Department
of Immigration and Citizenship, supplementary submission 129d, p 2.
1.6
As the Committee heard when they visited Headquarters Northern Command
in Darwin, recent years have seen a significant decline in the number of
unauthorised boat arrivals intercepted. Reasons for this decline include
increased resources invested in security, surveillance and interception in our
northern waters and increased cooperation with Indonesia and other partners in
our region in managing the numbers of people attempting to sail to Australia through transit countries and people-smuggling operations. It is acknowledged,
however, that unauthorised arrivals to Australia will likely continue to
fluctuate in response to external factors, such as natural disaster and
conflict, and the activities of people smugglers.[3]
1.7
As at 7 November 2008, there were 46 unauthorised air arrivals and 34
unauthorised boat arrivals in immigration detention. This was out of a total
detention population of 279.[4] The number of
unauthorised boat arrivals in detention at this time was in fact higher than
for the rest of 2008 as the first two boats to arrive in 2008 were intercepted
in September and October.[5]Ā
1.8
The majority of the detention population, approximately 80 per cent, is currently
comprised of people who have entered the country legally but have overstayed or
who have breached the conditions of their visa. DIAC advises that changes in
policy emphasis and improved program integrity are reducing the likelihood of
detention for this group.[6]
1.9
There has also been a fall in the number of illegal foreign fishers in
detention from 2879 individuals across 2005-06 to 1232 in the last financial
year (2007-08).[7] This decline is likely to
due to increased cooperation between DIAC, Customs, the Australian Navy, the
Department of Fisheries and the Indonesian Government in facilitating faster
repatriation of these fishers to their home regions. As of 7 November 2008 there are eight illegal foreign fishers currently in immigration detention.[8]
1.10
Figure C.3 illustrates the breakdown, by mode of arrival, of the 4514
people taken into immigration detention during 2007¢08.
Figure C.3ĀĀĀĀ People in
immigration detention during 2007-08, by arrival type/reason for detention
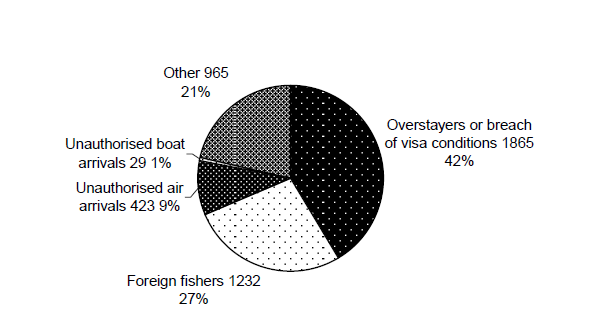 Source:ĀĀĀĀĀĀ Department
of Immigration and Citizenship, Annual report 2007-08 (2008), p 125.
Source:ĀĀĀĀĀĀ Department
of Immigration and Citizenship, Annual report 2007-08 (2008), p 125.
Source countries of people in detention
1.11
The source countries of the immigration detention population is largely
determined by international developments such as natural disaster, regional or
national conflicts, as well as the source countries for holders of various visa
types who may then become unlawful by overstaying or breaching the conditions
of their visa.
1.12
Between 1998-99 and 2001-02 people fleeing conflict in the Middle East
from Afghanistan, Iraq and Iran contributed to the significant increase in the
number of unauthorised arrivals by boat, and these nationalities were the most
represented in immigration detention.[9]
1.13
Table C.1 shows that since 2002-03, however, the most common nationality
amongst the detention population was Indonesian. As these figures include
illegal foreign fishers, this likely reflects increased numbers and
interceptions of illegal fishing vessels entering Australian waters from IndonesiaÆs southern regions.[10]
Table C.1ĀĀĀĀĀĀ Nationalities of people detained 2000-01 to
2007¢08 (ranked by majority)
|
2000-01 to 2007-08
|
|
Year
|
1st rank
|
2nd rank
|
3rd rank
|
4th rank
|
|
1996-97
|
Iraq
|
Sri Lanka
|
China, Peoples Republic Of
|
Somalia
|
|
1997-98
|
Indonesia
|
China, Peoples Republic Of
|
Iraq
|
Sri Lanka
|
|
1998-99
|
Iraq
|
China, Peoples Republic Of
|
Afghanistan
|
Turkey
|
|
1999-00
|
Iraq
|
Afghanistan
|
Iran
|
China, Peoples Republic Of
|
|
2000-01
|
Afghanistan
|
Iraq
|
Iran
|
Indonesia
|
|
2001-02
|
Iraq
|
Afghanistan
|
China, Peoples Republic Of
|
Indonesia
|
|
2002-03
|
Indonesia
|
China, Peoples Republic Of
|
Papua New Guinea
|
Malaysia
|
|
2003-04
|
Indonesia
|
China, Peoples Republic Of
|
Malaysia
|
Korea, South
|
|
2004-05
|
Indonesia
|
China, Peoples Republic Of
|
Malaysia
|
Korea, South
|
|
2005-06
|
Indonesia
|
Malaysia
|
China, Peoples Republic Of
|
Korea, South
|
|
2006-07
|
Indonesia
|
Malaysia
|
China, Peoples Republic Of
|
Philippines
|
|
2007-08
|
Indonesia
|
Malaysia
|
China, Peoples Republic Of
|
India
|
Source:ĀĀĀ Department
of Immigration and Citizenship, supplementary submission 129f, p 2. Data for
years prior to 2002-03 has excluded those for whom no nationality is reported.
Length of immigration detention
1.14
The length of time individuals spend in immigration detention has been a
persistent concern, as highlighted elsewhere in this report. For the majority
of individuals, however, detention is for a period less than one month, and
this percentage has been improving gradually since 2003-04 (figure C.4).
1.15
Since the introduction of mandatory reporting to the Commonwealth
Ombudsman there has been a significant decline in the number in people in
detention for two years or more particularly from 367 in 2007 to 42 as at 7
November 2008.[11]
Figure C.4ĀĀĀĀ Percentage of detention population with a length
of stay less than three months
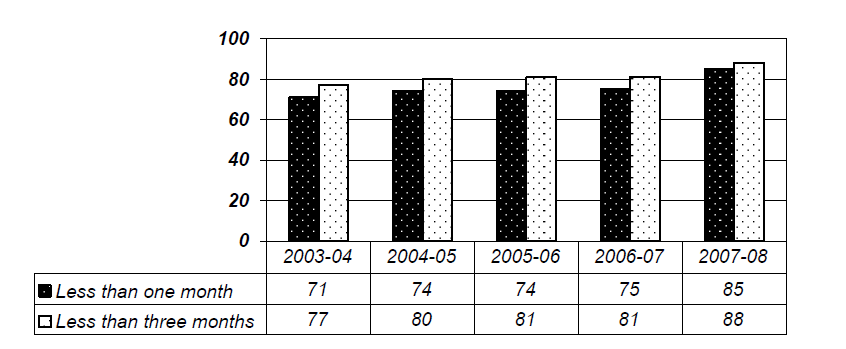 Source:ĀĀĀ Department
of Immigration and Citizenship, correspondence, 19 November and 27 November 2008.
Source:ĀĀĀ Department
of Immigration and Citizenship, correspondence, 19 November and 27 November 2008.
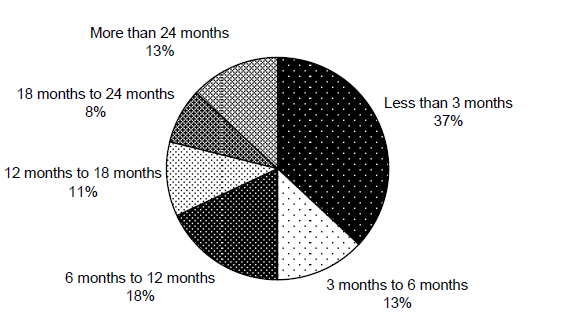
1.16
Figure C.5 provides a breakdown of the immigration detention population
at 30 June 2008 by the period of time spent in detention.
Figure C.5ĀĀĀĀ People in immigration detention by period
detained at 30 June 2008
 Source:ĀĀĀ Department
of Immigration and Citizenship, Annual report 2007-08 (2008), p 128.
Source:ĀĀĀ Department
of Immigration and Citizenship, Annual report 2007-08 (2008), p 128.


